"Colourtext always take a fresh approach to discovering hidden patterns in data. Whether you want to conduct segmentation or mine your CRM for deep insights, they will help you see your customers , and what they are seeing , in new ways."

We applied Quant Semiotics to 29,000 news articles to map and then forecast the evolution of new innovation trends in the Media & Market Research industry over a 17 year period.
Quant Semiotics is a data analysis and segmentation methodology that combines computational text and complex network analysis to segment a wide range of quantitative and natural language datasets.
It's important to appreciate from the get-go we're talking about *really big* datasets because scale is a crucial factor here. When the word count gets really big, words stop behaving like words and we have to begin treating them like numbers. This is when Quant Semiotics comes into its own, hence the name. To learn more about the scientific underpinnings of Quant Semiotics see our explainer here.
So, in the spirit of eating our own dog food we thought it would be fun to use Quant Semiotics to study our own sector - the Media & Market Research industry. We also have another public domain case study where Quant Semiotics is applied to the Skincare sector.
Project methodology
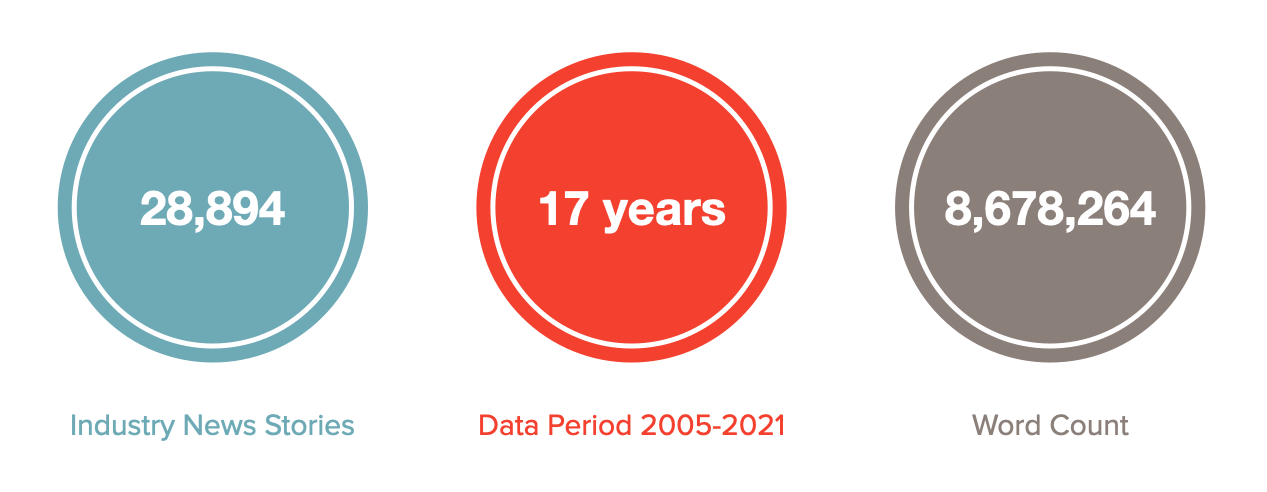
We set a web crawler loose on MRWeb.com, an online news publisher that focuses on the MR industry. The crawler brought back the page content from 28,894 industry news stories spanning a 17 year period that ran from January 2005 to December 2021.
The total word count topped out at 8,678,264 words (equivalent to 12,723 pages of A4 text), which pretty much satisfies the definition of a 'very big dataset'. But the really interesting thing about all this MRWeb content is that it presents a significant chunk and fair reflection of recent industry history.
We've assumed, not unreasonably, that anything of interest or note that happens within Media & Market Research is likely to feature within an MRWeb news article at some point in time. This makes our huge longitudinal dataset an excellent record of all the industry trends and innovations that have emerged over the past 17 years. It also makes it an excellent target for Quant Semiotics.
Project Headlines
The biggest story revealed by the Quant Semiotics analysis is a major change in the focus of the MR industry. The chart below reveals that for most of the 17 year period we covered the largest of the 5 themes that emerged from MRWeb news coverage was 'Traditional Market Research'.
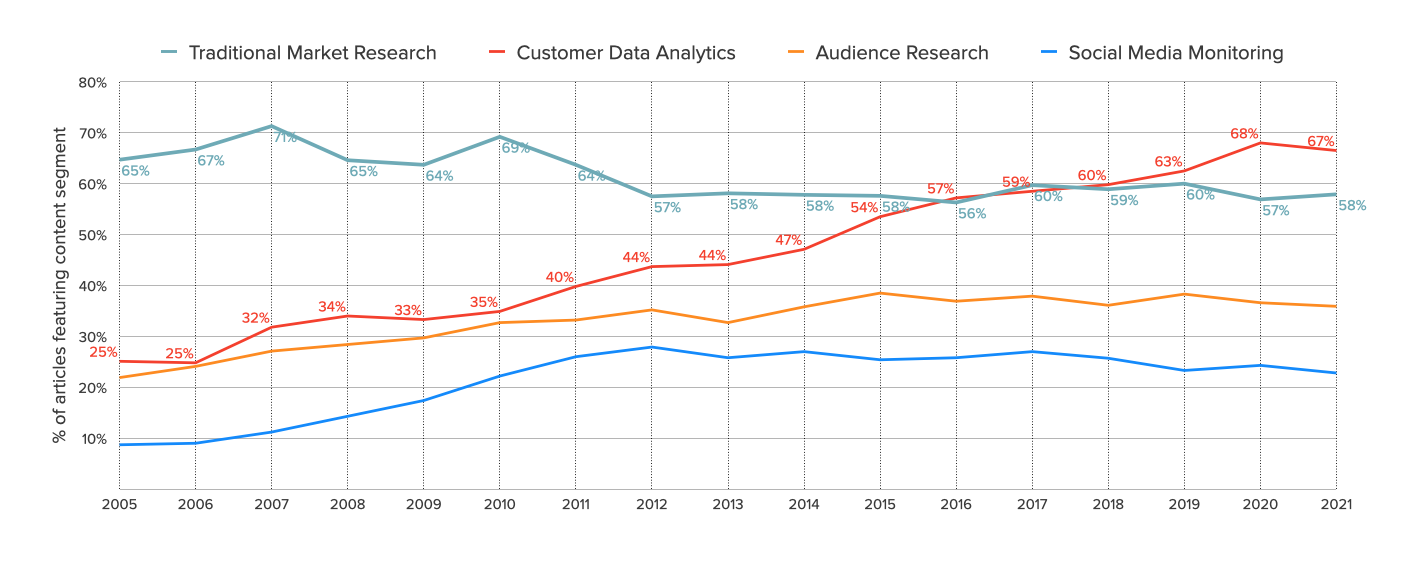
Between 2005 and 2015 ‘Traditional Market Research’ was easily the dominant sector within the Media and MR industry. However, coverage of this content segment has fallen from a high of 71% of news articles in 2008 to 58% in 2021. Although the original base of ‘Traditional Market Research’ discourse is still prevalent it no longer the provides the dominant structural concepts that influence thinking and business within the Market Research Industry.
This is evidenced by an unbroken run of year-on-year rises in the number of MRWeb.com articles that reference the ‘Customer Data Analytics’ segment. This reflects a sea change in both the shape and future direction of the industry.
Back in 2005 only 25% of industry news articles mentioned ideas like 'customer experience' and 'business intelligence', which are typical sub-components of this segment. However, that figure has risen steadily each year since and now stands at 66% of all MRWeb.com articles in 2021. Since 2019 ‘Customer Data Analytics’ has become the biggest content segment within Media and Market Research discourse.
The complex internal drivers of this sea change in the industry are fascinating and revealed by the chart below. Here we see the top 5 keyword components of the ‘Customer Data Analytics’ segment.
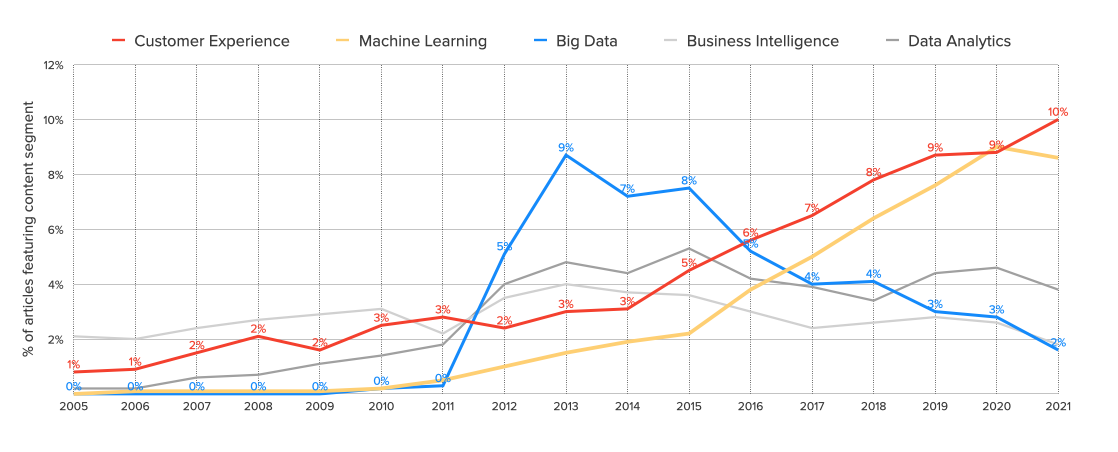
From the viewpoint of 2013 one could have been forgiven for thinking ‘Big Data’ represented the future of the MR industry. Between 2013 and 2015 this keyword was referenced by more MRWeb articles than any other concept or idea in the ‘Customer Data Science’ segment. However, by 2021 only 2% of news articles referenced it. 'Big Data' seems to be a clear case of a market fad. It flew high very quickly like a firework and then fell back down to earth almost as fast.
In contrast, much of the growth of the 'Customer Data Analytics’ segment can be attributed to the rise of ‘Customer Experience’ and ‘Machine Learning’, concepts that have pretty much defined the segment since 2017.
The question we asked ourselves was how useful would it have been in 2015 to have predicted that ‘Customer Experience’ and ‘Machine Learning’ would become as significant as they are in 2022? Was there anything embedded deep within the mass of MRWeb industry news content that might have anticipated the future rise of these ideas and the innovation they have given rise to within our market?
It turns out there was.
Trend forecasting the MR industry
Quant Semiotics has some really useful analytical features that appear to have a degree of predictive value. Through experiment we've found that Quant Semiotics can identify repeating network patterns within large volumes of text data that appear to anticipate real-world change and innovation trends with a fair degree of accuracy over one year, two year and sometimes longer time horizons.
We set out to develop a way to forecast the upward and downward movements of innovation trends within the Media & Market Research industry. We wanted to predict if an idea or concept, represented by a keyword, was going to get more important over time or whether it was going to fade from view. This is the kind of thing you'd want to do in any market sector or field of cultural interest.

We decided to use the frequency of web article appearances for a keyword within annual time periods as our 'dependent variable'. This means we used the number of times in a 12 month period an idea, concept or innovation is mentioned within a web article as the trend outcome we wanted to explain. This seemed like a reasonable way to define the 'success' or 'failure' of a trend over time. If people ain't talking about a thing, it just ain't a thing.
The network analysis component of Quant Semiotics employs a variety of algorithms to compute the topological significance of keywords within a dataset. After a lot of experimental trial-and-error we identified 3 network topology metrics that, in combination, appear to have a fair degree of predictive value. The metrics are called Keyword Connectivity, Strategic Significance and Concept Centrality and you can read a full description of them in our explainer article here.
We applied these tools to the 'Customer Data Analytics' content segment to test and validate their predictive potential. What follows are the results of this exercise. We examined 17 years of trend data for 8 of the leading keyword sub-components of the 'Customer Data Analytics' segment e.g. Machine Learning, Business Intelligence, Big Data etc.
For each keyword we produced 3 charts that map the normalised trend line for annual article appearances (the dependent variable we wish to explain) against the respective normalised trend lines for Keyword Connectivity, Strategic Significance and Concept Centrality (the independent 'explanatory' variables).
Trend 1: Customer Experience
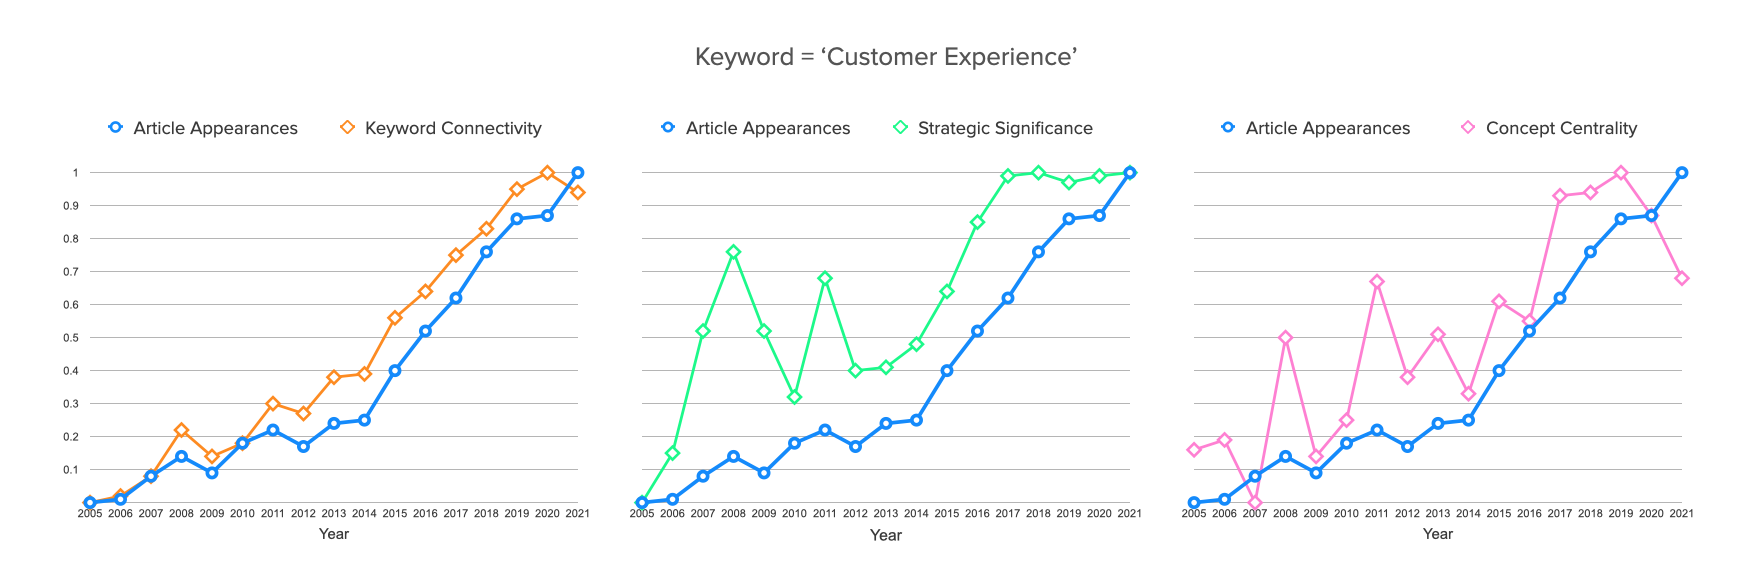
In 2005 only 1% of articles mentioned the keyword ‘Customer Experience’. However, use of the term has grown steadily every year through to 2021, with 10% of all MRWeb.com articles now mentioning the concept. This means 'Customer Experience' is currently the most popular keyword in the ‘Customer Data Science’ content segment.
The first chart above shows that after 2010 'Customer Experience' grew the number of its connections with other keywords at a faster rate than the growth of the term's appearance within new articles. Both trend lines grew in a linear fashion and correlate closely with each other.
The second chart shows that from 2005 until 2016 growth in the strategic significance (or prestige) of 'Customer Experience' has outpaced article appearances. The strategic significance of 'Customer Experience' within MR news coverage has since been maintained at its 2016 peak, which continues to be reflected in the growth of articles mentioning the concept.
However, the third chart shows that for the first time in 13 years we see the trend line for Conceptual Centrality, or indispensability, of 'Customer Experience’ falling below the number of article appearances. This might indicate that market innovation is evolving and the concept of ‘Customer Experience’ may have reached the zenith of its influence on market thinking or innovation.
Trend 2: Big Data
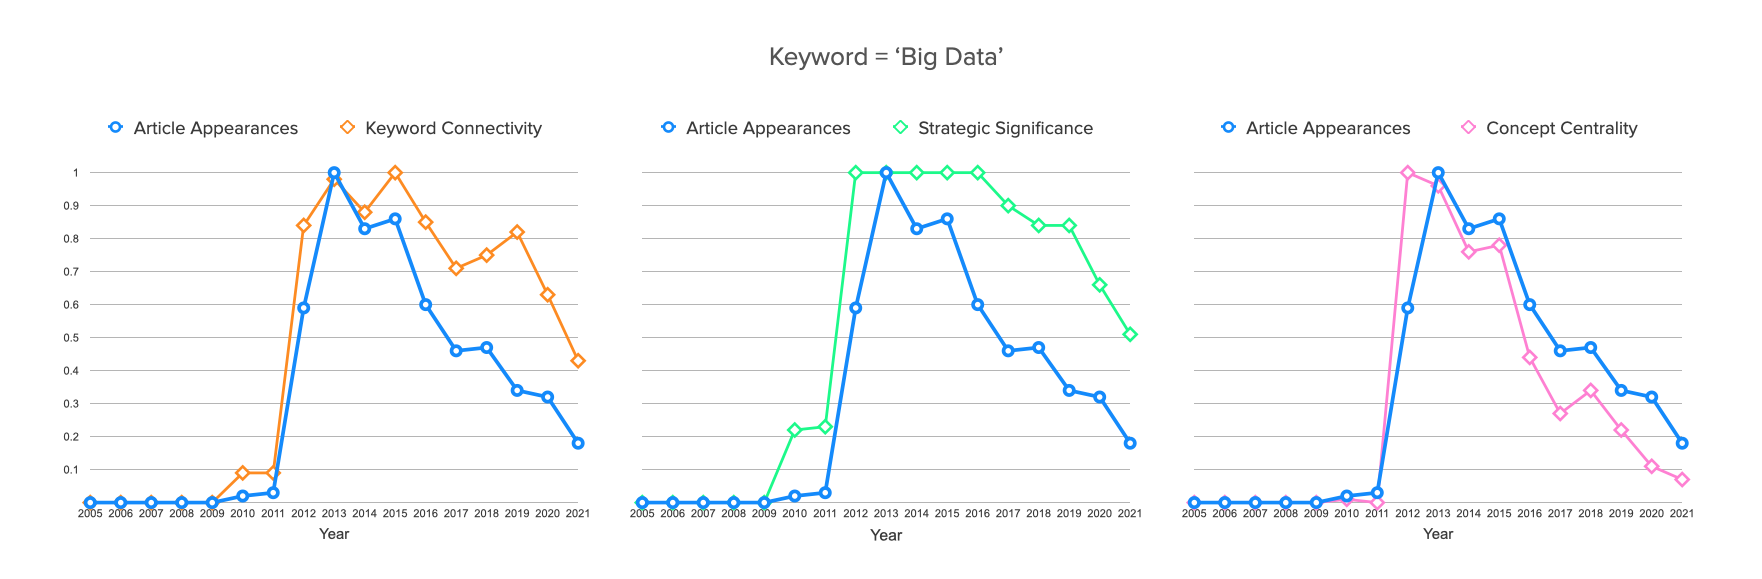
Between 2013 and 2015 the keyword ‘Big Data’ was referenced by more MRWeb articles than any other concept or idea in the ‘Customer Data Science’ content segment. However, by 2021 only 2% of news articles referenced it.
'Big Data' seems to be a good example of a fashionable fad or firework - it went up high very quickly in 2011 and then fell back to earth almost as fast. The first chart shows that between 2011- 2013 the number of connections made between 'Big Data' and other keywords or ideas grew as rapidly as article appearances. But after the peak of appearances in 2013 the number of keyword connections fell more slowly, suggesting ‘Big Data’ continued to be mentioned in a broad number of contexts but the strategic relevance of the term itself had diminished slowly over time.
The middle chart shows that a 5 year period of very high market significance or prestige seems to have underwritten a very high spike in coverage for the concept of 'Big Data’. However, the trend differential between the article count and strategic significance measure has widened negatively since 2016.
Perhaps the third chart is the most interesting here becuase it shows the conceptual centrality or indispensability of 'Big Data' has been falling continuously below its article appearance rate since 2013. This indicates the term 'Big Data' is falling out of fashion and the fall seems to have been most effectively anticipated by the term’s loss of conceptual centrality or indispensability.
In other words, the idea of ‘Big Data’ stopped being a preferred way for the market to think about or describe its future direction. This metric seems to be consistently effective at foreshadowing a falling trend in the frequency of article appearances for keywords in a market.
Trend 3: Data Analytics

Between 2005 and 2021 the keyword ‘Data Analytics’ has been the third most frequently referenced concept in the ‘Customer Data Science’ content segment. The first chart shows the trend lines for the number of article appearances and growth in conceptual connectivity or ‘idea links’ for 'Data Analytics' have been closely correlated and grown in lockstep since 2007. What's interesting is that the keyword’s early growth period for article references (2008-2012) seems to have been preceded by a more rapid growth in Keyword Connectivity.
The second chart shows a rise in article mentions from 2007 for 'Data Analytics' seems to have been preceded by an even steeper rise in the keyword’s co-occurrence with other strategically significant keywords being used within the MR industry. The two trend lines converged in 2013, signalling the end of the term’s rapid growth phase in market usage. Usage of ‘Data Analytics’ then fell back between 2015-2018, but the strategic significance of the term has been maintained at levels closer to its peak. This seems to precede the partial recovery of article appearances from 2019 onwards.
However, the last chart shows that since 2016 the growing variance between the Conceptual Centrality (or indispensability) of ‘Data Analytics’ and its article appearances suggests the term may have peaked as a fashionable idea that shapes the MR agenda. It may now be settling down into an mature structural component of regular market discourse and commercial activity. This metric seems to do a good job of anticipating the downward trend in the usage of this keyword within MR news articles.
Trend 4: Machine Learning
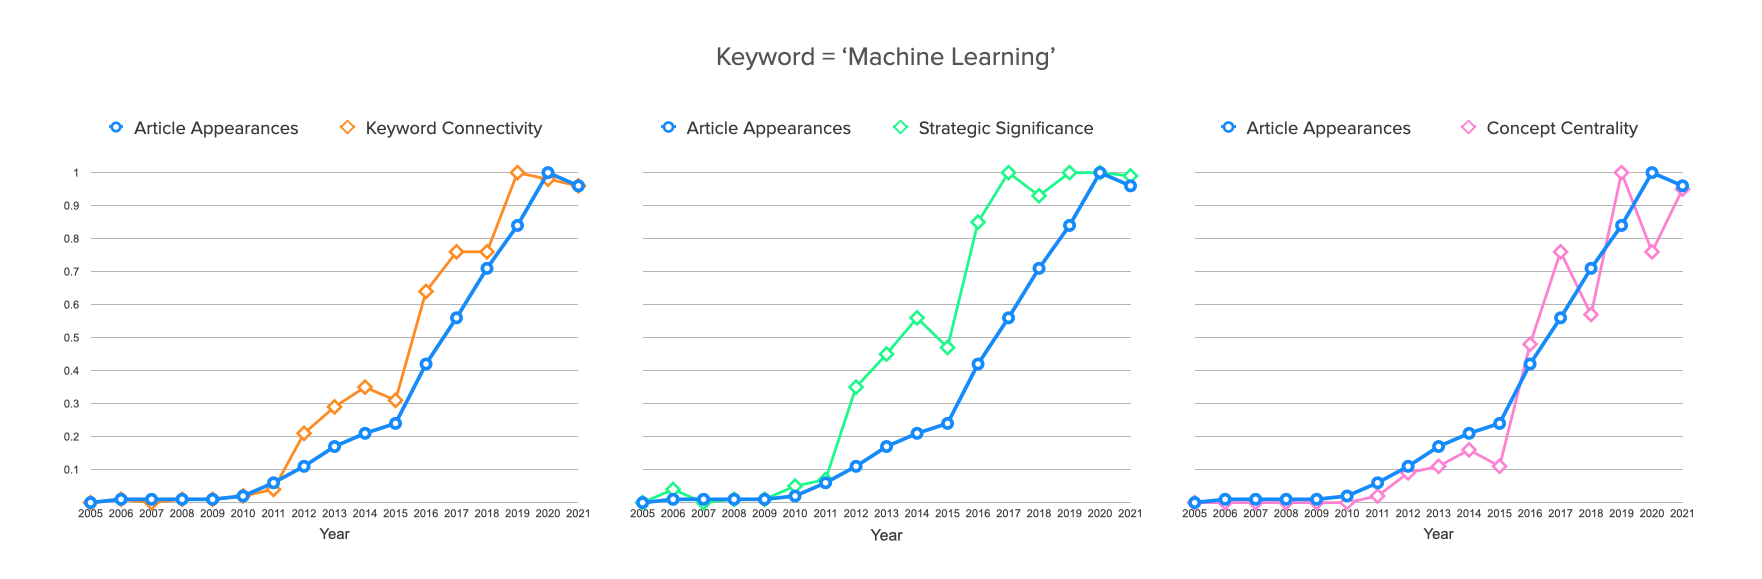
In 2020 and 2021 the keyword ‘Machine Learning’ drew level with ‘Customer Experience’ to be the most frequently referenced concept in the ‘Customer Data Science’ content segment. The first chart shows how a rise in article appearances for 'Machine Learning' has been preceded since 2012 by a higher rate of Keyword Connectivity with other terms. This trend of connectivity growth appears to have paused slightly since 2019.
The second chart shows that the growth in frequency of mentions for 'Machine Learning' within industry news articles appears to have been foreshadowed by an even more rapid growth in the Strategic Significance (or prestige) of the term during the same period. The current peak in significance for ‘Machine Learning’ is currently being maintained, suggesting the importance of the term will either continue to grow or maintain its current high status within the industry.
The last chart suggests this prediction seems to be supported by a rising trend of Conceptual Centrality, or indispensability, for ‘Machine Learning’ within the regular discourse and commercial activity of the MR industry.
Trend 5: Artificial Intelligence
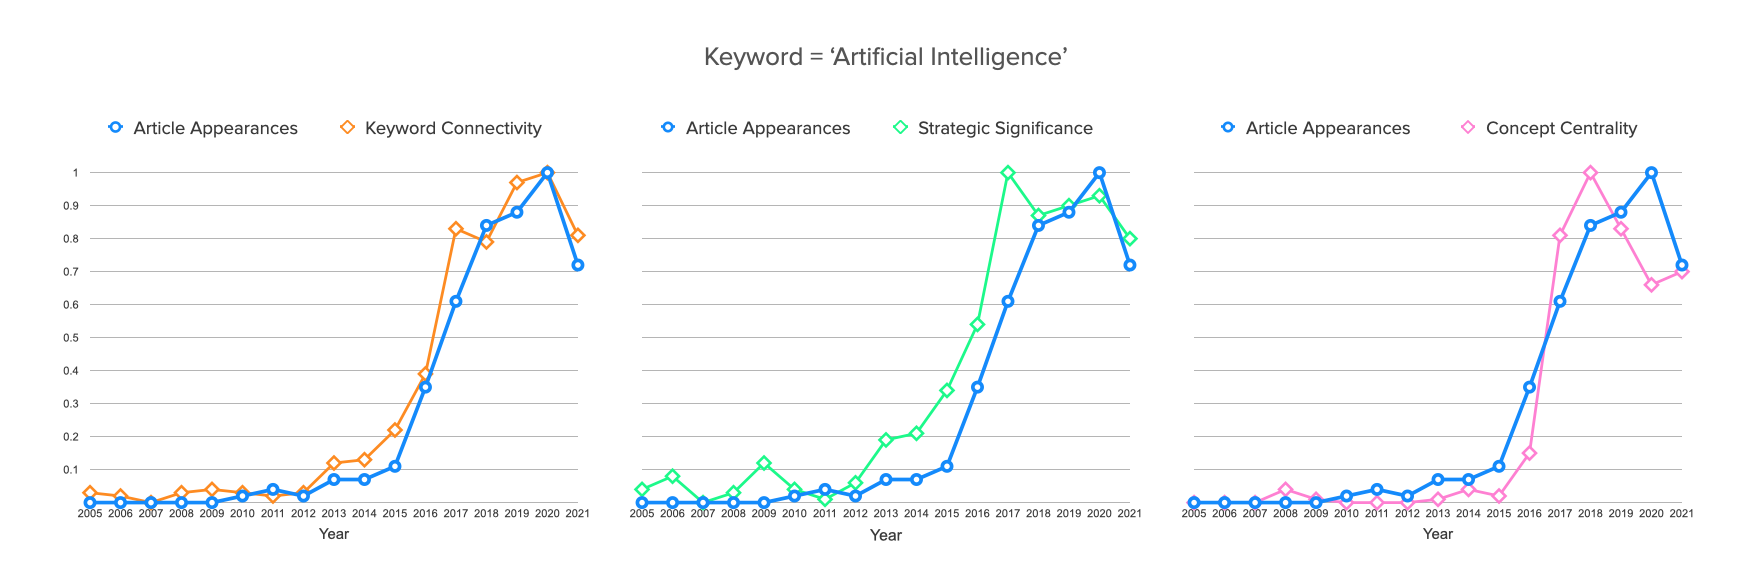
‘Artificial Intelligence’ and ‘Machine Learning’ are synonymous to a large degree, so it’s unsurprising their growth trends mirror each other fairly closely. However, this data reveals that the use of ‘Machine Learning’ is significantly more prevalent, suggesting ‘Artificial Intelligence’ seems to be the junior concept in the MR space.
The rise in article appearance for ‘Artificial Intelligence’ has been accompanied by the familiar higher-trend growth of both the Keyword Connectivity and Strategic Significance metrics, which we see clearly in the first two charts.
However, the data reveals that both ‘AI’ and ‘MR’ have suffered a fall in usage over the last 12 months but the drop for AI has been more pronounced. Indeed, the Concept Centrality trend line in the third chart appears to have dipped below that of article appearances for the first time and therefore suggests the use of ‘Artificial’ Intelligence’ as a strategically significant term within the MR industry may now be past its peak.
Trend 6: Business Intelligence
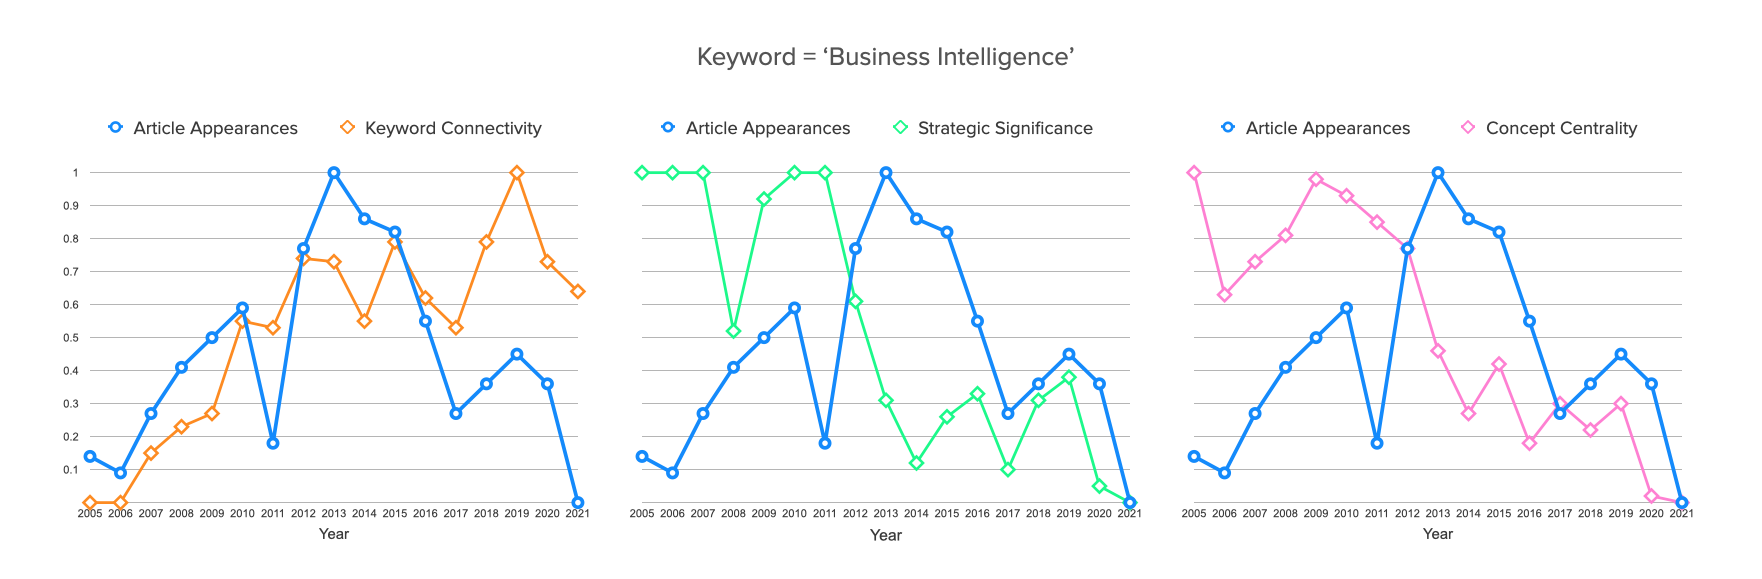
Between 2005 and 2021 the keyword ‘Business Intelligence’ has been the 5th most frequently referenced concept in the ‘Customer Data Science’ content segment. The growth in articles referencing ‘Business Intelligence' peaked in 2013 but has since fallen back to where it began in 2005.
However, in the first chart se see the level of Keyword Connectivity for ‘Business Intelligence’ has continued to rise over the whole period, including beyond the moment of peak article references. This doesn’t follow the relationship between article appearances and keyword connectivity established for other important keywords. So what’s going on here?
The fall in article appearances for 'Business Intelligence' from its 2013 peak seems to have been more successfully anticipated by both the Strategic Significance (2nd chart) and Concept Centrality (3rd chart) data. Both metrics seem to foreshadow the steep rise in mentions of 'Business Intelligence' but begin to fall away sharply at least 2 years before the peak in article appearances. This seems prescient.
A reasonable explanation for the divergence from pattern we see in the first chart could be that the MR community continued to talk about 'Business Intelligence' long after it ceased to be an important organising concept or principle for the industry.
This is evidenced by the falling significance and centrality trends evidenced in the 2nd and 3rd charts. As we see in chart 1, ‘BI’ doesn’t get mentioned as much as it once did, but when it does it’s connected to a growing number of concepts and ideas. This suggests 'BI' has evolved into something of a background or 'wallflower' concept that finds general application across a broad range of contexts.
Trend 7: Data Science
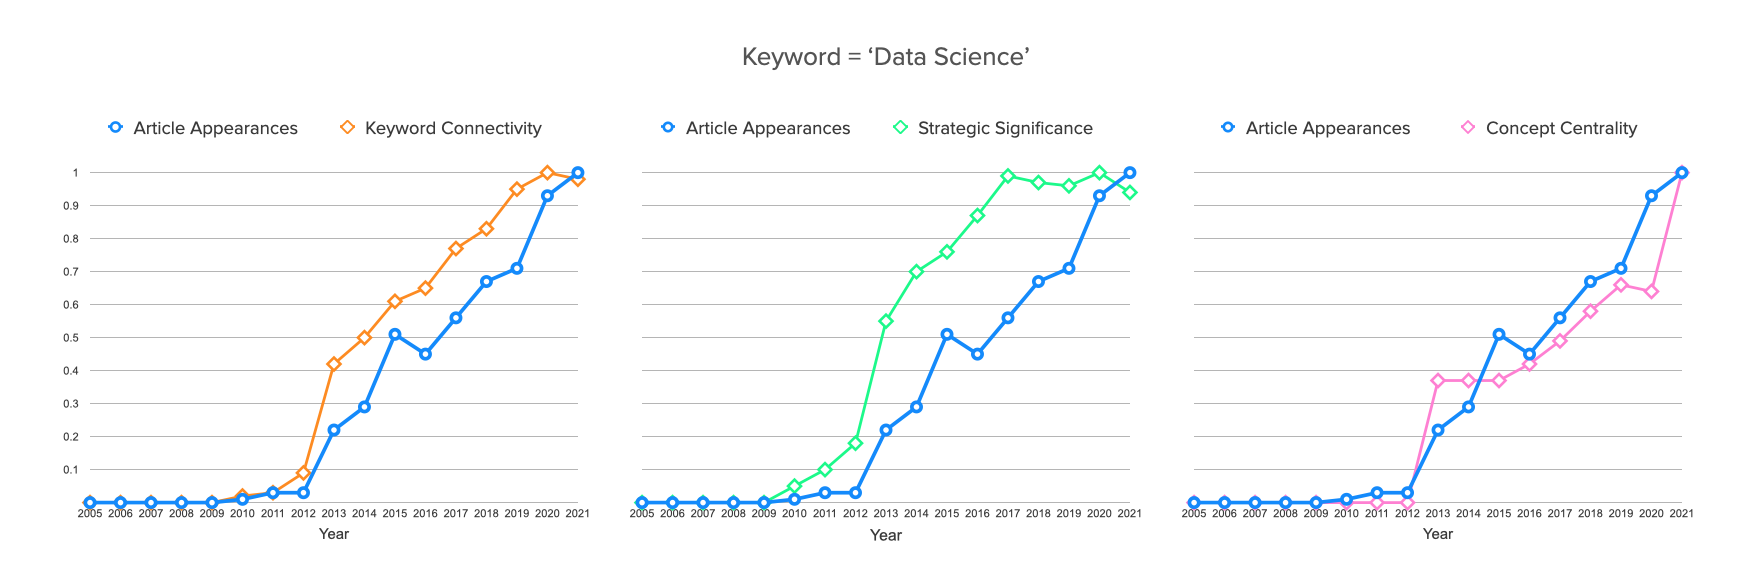
‘Data Science’ is a relatively new entrant to the MR market, with growth in the number of news articles mentioning the concept not really getting off the ground until 2013 and then gowing quickly through to 2015. However, from 2016 onwards the growth rate of article appearances for ‘Data Science’ has moderated somewhat and this trend has remained steady through to 2021. Nevertheless, it is currently the second or third most frequently mentioned keyword within the ‘Customer Data Science’ content segment.
The impressive growth in article references for ‘Data Science is reflected in above-trend growth for both the Keyword Connectivity and Strategic Significance metrics relative to article appearances (Charts 1 & 2). In both cases the positive variance of both metrics over mentions gave a good indication that this concept would become stronger and more prevalent over time.
However, the trend line for Concept Centrality in the third chart takes an interesting turn in direction after 2013 and remains below the growth trend for article appearances thereafter. This coincides neatly with the relative flattening of the growth curve for mentions of 'Data Science', which suggests the Concept Centrality metric is useful for predicting either a flattening or downturn in a concept’s fortunes within the MR market.
Trend 8: Predictive Analytics
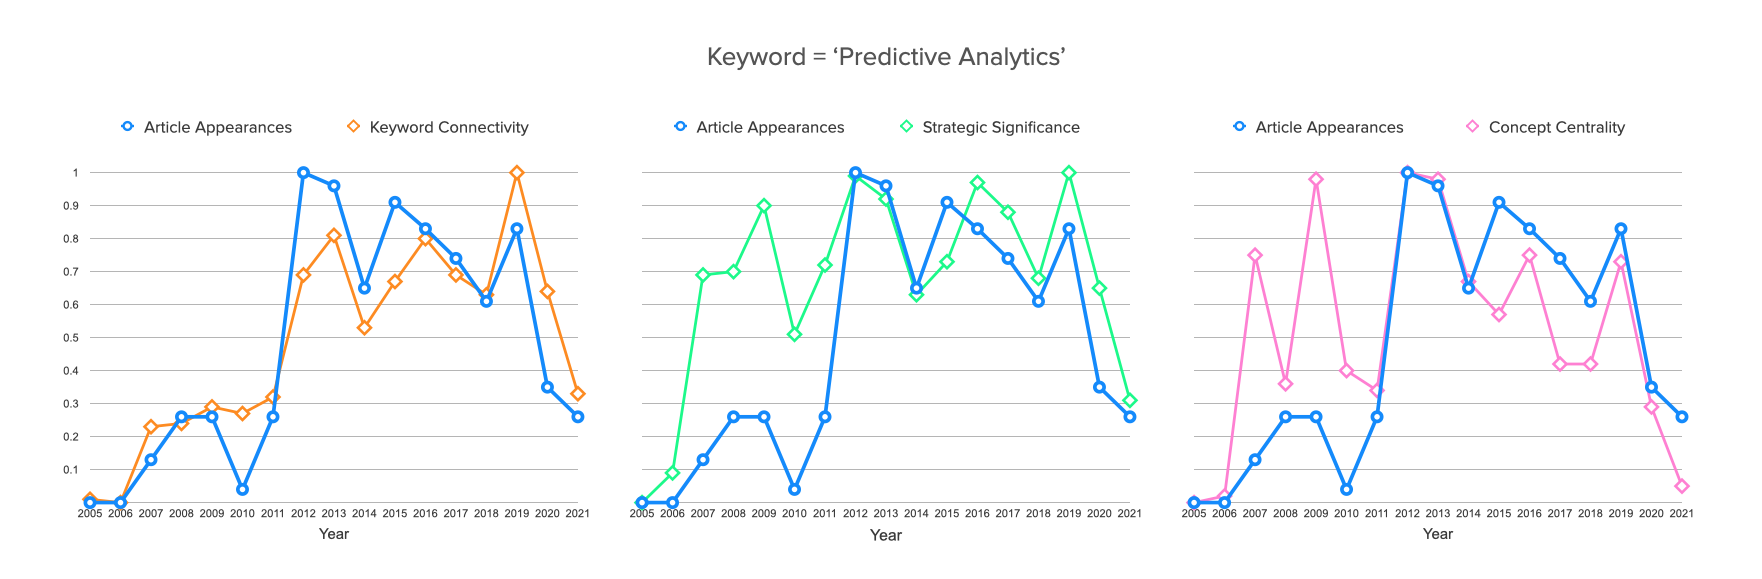
‘Predictive Analytics’ is the 16th most mentioned keyword (out of around 200) within the ‘Customer Data Science’ content segment. It’s not the biggest or most significant concept in the market today but it has an obvious connection to the objectives of this analysis. So, in the spirit of eating our own dog food, what does this analysis technique have to say about the future of ‘Predictive Analytics’?
The trend for mentions of this term tends to reflects the popularity of ‘Data Analytics, which seems broader and less specific in its meaning and application. However it’s fair to say that of the two, mentions of ‘Predictive Analytics’ have proportionally slipped the most during recent years.
Between 2006 and 2011 Keyword Connectivity (Chart 1) grew faster than article appearances, which foreshadowed a spike in coverage from 2011-2013. But from this point to 2018 the growth of Keyword Connectivity lagged that of mentions. This seems to be reflected by a general downward trend in mentions that stretches (save for the odd bounce) all the way to 2021.
However, in 2019 the trends for both Keyword Connectivity and Strategic Significance (Chart 2) outpaced article appearances, yet in all cases the trends continued to slide. This pattern is reminiscent of the one exhibited by the ‘Big Data’ keyword.
The resemblance to ‘Big Data’ continues when we see how the Concept Centrality trend (Chart 3) has developed for ‘Predictive Analytics’. As in the former case, the trend for Concept Centrality has undershot article mentions during their decline of 2015 to 2021.
The data suggests we may be entering, if not already experiencing, a 'Predictive Analytics' winter - oh dear! It's therefore hard not to conclude that 'Predictive Analytics' isn't a hot or fashionable concept right now in MR, which is sad for the purposes of this article but here's hoping we can change this sorry trend!
Summary Conclusions
Specific features of Quant Semiotics data analysis appear to have a degree of predictive value. Through experiment we've found Quant Semiotics can identify repeating network patterns within large volumes of text data that appear to anticipate real-world change and innovation trends with a fair degree of accuracy over one year, two year and sometimes longer time horizons.
Experimental trial-and-error has identified three network topology metrics that, in combination, appear to have a fair degree of predictive value. They are called Keyword Connectivity, Strategic Significance and Concept Centrality. We're currently working on algorithms to measure the relative frequency of correct and incorrect predictions and will publish these results at a later date. In the meantime, here's a summary of our key findings.
Keyword Connectivity measures the number of co-occurences a specific keyword establishes with other keywords. When this happens at scale across thousands of web articles (or 'documents'), co-occurrences become statistically significant and meaningful. In many cases a growing Keyword Connectivity score precedes future increases in web article appearances for a new idea or innovation.
The Strategic Significance metric identifies strategically connected keywords that are connected to other terms of high significance. In many respects this metric gives us a ‘market prestige' score for a keyword. When we see a rising Strategic Significance score it can foreshadow a rise in web article mentions for a specific concept or innovation.
Concept Centrality identifies important 'junctions' or 'bottlenecks' within language network structures that play an essential role in shaping and defining the core characteristics of a market topic or theme. When a keyword's Concept Centrality scores rises it tends to mean the idea represented is becoming more central to debate and other concepts or themes are beginning realign themselves around it. Conversely, when Concept Centrality scores fall it tends to signify decline in a keyword's market salience or relevance. This makes it a very useful predictor of when downward trends in popularity are likely to set in for specific ideas.
To talk about applying Quant Semiotics to your brand or market contact us now.